


Feature Overview
Integrated Tools for Comprehensive Data Analysis
AUDIPY is a versatile software tool for analysing, processing and visualising structured datasets. It supports you in efficiently searching, filtering and evaluating large volumes of data in a targeted way – without complicated processes or additional tools.
Thanks to its flexible architecture, complex analyses can be carried out just as easily as quick day-to-day evaluations. Below you will find an overview of the core functions that make AUDIPY a powerful tool for data analysis and visualisation.

Thanks to its flexible architecture, complex analyses can be carried out just as easily as quick day-to-day evaluations. Below you will find an overview of the core functions that make AUDIPY a powerful tool for data analysis and visualisation.
BASICS, FILE MANAGEMENT AND IMPORT
Supported File Formats
- Parquet – Highly optimised column format (standard format)
- Excel – XLSX, XLSB, XLS (all versions)
- CSV / TXT – Automatic character set and delimiter detection
- XML – Structured data imports
- JSON – Support for nested structures
- DBF – DBase files
- ORC – Apache ORC format
- Power BI – Direct extraction from PBIX files
Database Connectors
- Microsoft SQL Server – With Windows authentication
- MySQL & MariaDB – Full compatibility
- PostgreSQL – Native support
- SQLite – Embedded databases
- Microsoft Access – MDB/ACCDB via ODBC
- ODBC – Connection to any data source
- SSL/TLS encryption for secure connections
Import Wizards
- Data Wizard for CSV/TXT with preview and delimiter detection
- Skip headers or footers, character set selection (UTF-8, ISO, etc.)
- Excel Wizard with Smart Merge and automatic header detection
- Merging multiple worksheets
- Report Wizard for extraction from PDF files
- Database Wizard with SQL Query Builder
- Connection test and error diagnostics integrated
Special Imports
- GoBD-compliant XML import (Index.xml with references)
- SAP DART files – Automatic structure import
- XRechnung – Extraction and visualisation
- Power BI Integration – Access to DAX & M Queries
- Batch import – Read multiple files simultaneously
- Folder import – Recursive processing of entire directories
Explorer & Project Management
- Hierarchical file explorer with tree view
- Project and case management with quick switching
- Data lineage – Tracking of derivations
- Creation and management of custom folder structures
- Multiple files open simultaneously (tab system)
- Drag & Drop – Import files directly
DATA EXPLORATION AND INTERACTION
Column Formatting
- Automatic detection and conversion of date formats
- Support for Unix timestamps and Excel serial numbers
- Number formats – Integers, decimals, EU/US separators
- Thousands separators, percentage and currency display
- Formatting for text, Boolean and hyperlinks
- Configurable decimal places and display precision
Column and Row Actions
- Duplicate, rename, delete or hide columns
- Reorder via drag & drop with automatic saving
- Adjust column widths individually and save permanently
- Sort by one or more columns
- Copy cell contents – individually or in blocks
- Editable columns – Direct editing in the table
- Add or delete rows in edit mode
Advanced Filtering
- Simple filters – Equal, Not equal, Contains, Starts with, Ends with
- Range filters – Greater than, Less than, Between
- Date filters – Year, month, week, weekday or time periods
- Fuzzy filter – Similar values with configurable accuracy
- Multi-value filter – Select multiple values (In / Not In)
- AND/OR logic – Combine multiple filter conditions
- Filter bookmarks – Save, name and reuse
Column Statistics
- Sum, mean, median, minimum and maximum
- Standard deviation, variance and quantiles (25%, 50%, 75%)
- Unique values – Frequency and cardinality analysis
- Null values – Detection and percentage display
- Type-adaptive statistics – Automatic detection of text, number or date
- Inline display of statistical results in tables
External Actions & Integration
- Google Search – Start directly with cell content
- Google Translate – Translate selected content
- Google Maps – Interactive address search and map view
- XRechnung visualisation – Display structured invoice data
- Link to external Parquet files (Cross-File Lookup)
- Launch external applications from context menus
- Execute custom Python scripts or analyses
User Interface & Interaction
- Multilingual interface – German, English, Dutch
- Design themes – Light, Dark, Custom
- Zebra pattern – Alternating row colours for better readability
- Adjustable font size, DPI scaling for high-resolution displays
- Context menus with quick access to all table functions
- Responsive layouts for different screen sizes
DATA PROCESSING AND TRANSFORMATION
Stream Processing
- Processing very large datasets in partial sections
- Significantly reduced memory consumption thanks to streaming
- Stream extraction – Real-time filtering during import
- Stream grouping – Aggregation without memory overflow
- Stream join of large files
- Stream append – Merging many files
- Stream pivot – Creating large cross-tables in stream
- Based on DuckDB – Highest performance and efficiency
Data Joins
- Inner Join – Only matching records
- Left Join – All records from the left table
- Right Join – All records from the right table
- Full/Outer Join – All records from both tables
- Anti Join – Only non-matching records
- Fuzzy Join – Similarity-based matching
- Join across multiple key columns
- Append / Concatenate – Add tables row by row
Data Cleansing
- Find and automatically remove duplicates
- Delete empty rows – completely or partially
- Fill missing values (Forward/Backward Fill, Mean, Median)
- Outlier detection using statistical methods
- Data type validation – automatic correction
Column Transformation
- Merge – Combine columns with delimiters
- Split – By delimiter, length or pattern
- Extract – Numbers only, text only or by RegEx
- Replace – Substring or exact match
- Text operations – Trim, convert to upper/lower case
- Date operations – Extract year, month, day or time components
Aggregation & Pivot
- Group by one or more columns
- Standard aggregations – Sum, average, count, min, max
- Advanced aggregations – Median, variance, standard deviation
- Pivot tables – Flexible cross-tables with multiple values
- Drill-down – Interactive detail view in pivot results
- Custom calculations and groupings
Calculated Columns
- Formula editor with real-time preview
- Mathematical operators (+, -, *, /, %, power)
- Statistical functions – Mean, median, standard deviation
- Date/time differences – Calculate time intervals
- Lag/Lead – Reference to previous or next row
- If-Then functions – Arbitrarily nested conditions
- Cumulative sums with grouping
- Full support for Python expressions
New Columns
- Editable text columns for manual input
- Editable numeric columns for calculations
- Index column – Sequential numbering
- Audit column – Manual markings (✔, ✖ or empty)
- Constant column – Fixed values for all rows
Comparison & Difference Analysis
- Table comparison – Compare two datasets directly
- Row-by-row analysis – Added, removed, changed entries
- Column-by-column differences – Make field changes visible
- Diff report – Clear summary of changes
- Export of differences to Excel
AI FUNCTIONS (ASK MY DATA – AMY)
AI Chat Interface
- Ask my Data (AMY) – Ask questions in natural language
- Answers as text, table or interactive charts
- Automatic Python code generation for analyses
- Error correction and improvement suggestions for code
- Context preservation – Follow-up questions and multi-step dialogues
- Gatekeeper function: If imprecise, AMY asks for clarification
- Favourite prompts: Save prompts and execute via quick command
Supported AI Models
- AUDIPY AI – GDPR-compliant, fully data-privacy-secure
- OpenAI – Various models (optionally integrable)
- Deepseek – Various models
- GPT4All – Local models without internet connection
- Custom APIs – Connection to custom endpoints
- With AUDIPY AI: Only metadata (e.g. column names) is processed
- No sensitive data content leaves the system
Magic Prompts & Playbooks
- Magic Prompt Generator – Context-dependent analysis suggestions
- Consideration of industry, data content and system context
- Automatic data quality check – Missing values, duplicates
- Outlier and anomaly detection
- Distribution analysis for identifying data patterns
- Playbook creation for secure analysis with AI agents
AI-Assisted Column Creation
- AI Column Generator – Create new columns automatically
- Complex transformations without programming knowledge
- Extraction of text patterns via AI analysis
- Automated calculation of context-related values
AI Visualisation & Insights
- Automatic chart generation – Select the optimally fitting chart
- Insight generation – Important findings are highlighted
- Trend detection – Identification of developments in the dataset
- Anomaly explanation – AI provides explanations for unusual values
- Visual storyboards – Automatically generated analyses as a report
Documentation & Sharing
- AMY bookmarks – Save and re-execute AI queries
- Automatic documentation of all AI analyses performed
- View, edit and export Python code
- Save interactive charts as HTML or PNG
- Reproducible workflows – Analyses exactly repeatable
- Column description generation by AMY
DATA ANALYSIS AND VISUALISATION
Descriptive Statistics
- Unique values (all columns) – Identify primary keys
- Unique values (column) – Frequency analysis
- Missing values – Check data completeness
- Value distribution – Percentage and absolute frequencies
- Quartiles – 25th, 50th, 75th percentiles
- Summary – All key metrics at a glance
Outlier Analysis (Anomalies)
- Isolation Forest – AI-based outlier detection
- Z-Score and Modified Z-Score – Classic statistical methods
- Rolling Z-Score – Optimised for time series
- Automatic mode – Selects the best method based on data type
- Category-based analysis – Group-specific evaluation
- Interactive visualisation – Display with rolling median
Distribution Analysis
- Histogram with various bin methods (Sturges, Rice, Scott, Freedman-Diaconis)
- Kernel Density Estimation (KDE) – Smooth density distribution
- Box plot and violin plot – Compare quartiles and distribution
- Comparison with theoretical normal distribution
- Category-based overlays – Multiple groups in one view
Time Series Analysis
- Seasonal Decomposition – Breakdown into trend, seasonality and residuals
- Trend and pattern recognition over time
- Rolling averages – Moving averages
- Line charts and area charts for trend visualisation
- Seasonal comparison views across multiple periods
Benford Analysis (Digit Analysis)
- Forensic method for detecting potential manipulation
- First, second and combined digit testing
- Last digit check – Validate trailing digits
- Category-based Benford analysis – Grouped checks
- Visual representation of deviations from Benford distribution
Gap Analysis
- Check completeness of sequential number ranges
- Check invoice numbers for gaps and duplicates
- Grouped number ranges by prefix or category
- Reset fields for periodic numbers (e.g. annually)
- Timeline visualisation to display gaps
Advanced Visualisations
- Network diagrams – Relationships between entities
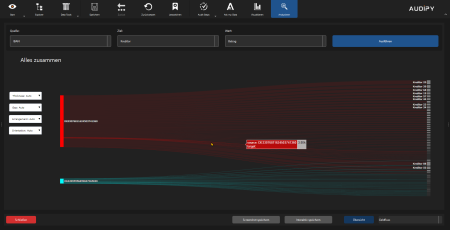
- Sankey / Money Flow – Representation of cash flows
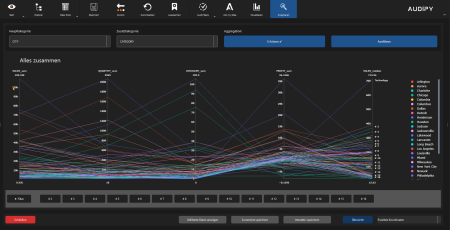
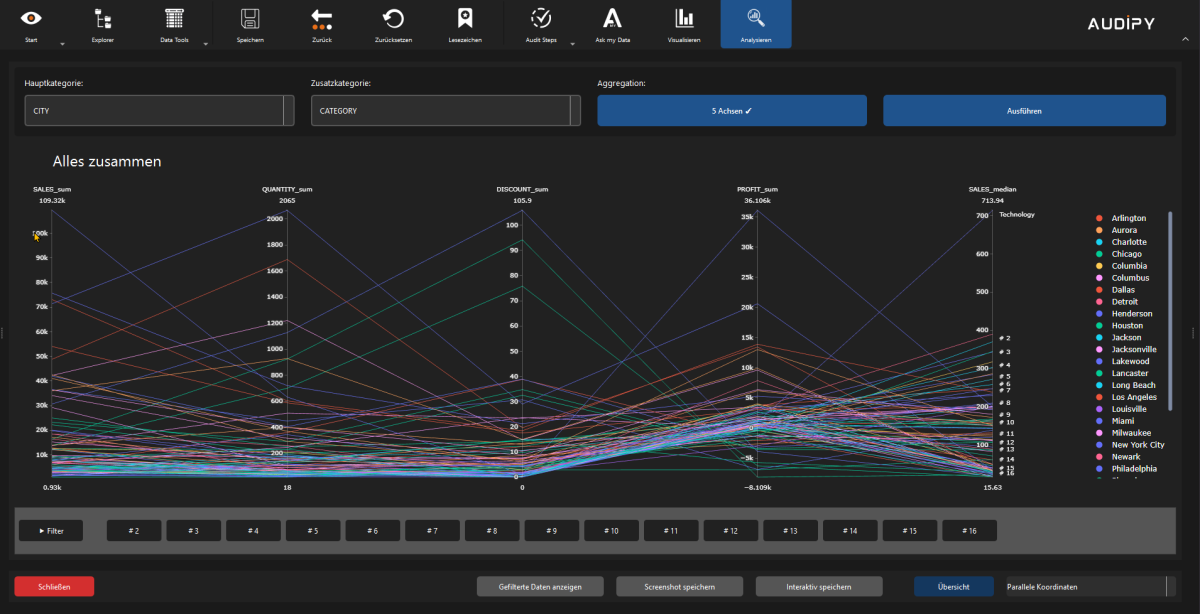
- Parallel coordinates – Multidimensional data analysis
- Scatter plots – Correlations between variables
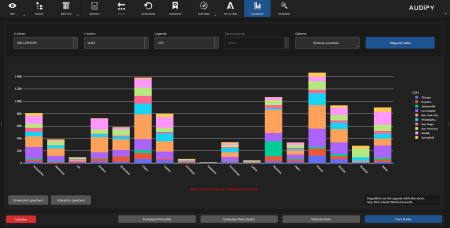
- Bar and line charts – Visualise shares and categories
Interactive Charts
- Plotly-based interactive visualisations
- Zoom, pan and selection functions directly in the chart
- Hover tooltips with detailed information
- Export as interactive HTML or static image (PNG)


AUDIT, COMPLIANCE AND ADVANCED FEATURES
Audit Steps & Reproducibility
- Audit Steps – Reusable, standardised audit procedures
- My Audit Manager – Management of audit workflows
- Define and save custom audit steps
- Python scripts for automated audits
- Automatic documentation of all actions
- Easy recording of audit steps at the push of a button
- Audit Step Editor: Build your audit routines with custom user dialogs
Monetary Unit Sampling (MUS)
- Sample planning using Poisson, Alpha-Beta and Hypergeometric methods
- Cumulative value selection – Systematic extraction
- Sample evaluation using various methods
- Tainting & extrapolation – Projection to the population
- Reproducible thanks to seed values
- PDF report for documentation
Bookmark System
- Analysis bookmarks – Save complete views
- Reuse filter, pivot and chart bookmarks
- Notes and descriptions for each entry
- Colour markings for categorisation
- Quick access via the dashboard
Data Integrity & Security
- Hash chain technology – Guarantee immutability
- SHA-256, MD5 and xxHash – Cryptographic checksums
- Signature verification – Ensure data provenance
- History report – Complete change history
- Metadata management – Store extended data information
- Encrypted API keys for secure integration
Export & Reporting
- Parquet, CSV and Excel export with formatting options
- PDF reports with integrated visualisations
- HTML export – Interactive reports as web pages
- Power BI export – Create PBIX files directly
- Column selection for targeted export
- "What you see is what you get" – Filters are carried over
Sampling Methods
- Random and systematic samples
- Stratified samples by category
- Value-proportional selection (MUS) – Risk-based
- Reproducible results through seed values
- Automatic calculation of sample size
Developer Mode & Advanced Features
- Metadata management – Read, delete, replace
- Python integration for individual automations
- Debug logging for detailed error analysis
- Feature toggles – Activate experimental functions
Compliance Support
- GoBD-compliant – Meets German accounting standards
- GDPR-compliant – Data protection fully guaranteed
- Audit-proof – Immutable documentation
- Complete audit trail for full traceability
- Privacy by Design – Data protection integrated from the start
PERFORMANCE & SCALABILITY
Big Data Handling
- Streaming operations – Process large datasets without fully loading them
- DuckDB integration – In-memory analytics for millions of rows
- Chunked processing – Processing in flexible blocks
- Intelligent memory management – Automatic memory cleanup
- Lazy loading – Load only currently needed data
- Column selection – Read only relevant columns
Asynchronous Processing
- Background processing – UI remains responsive during processing
- Multi-threading – Parallel execution of tasks
- Resource management – Automatic release of unused memory areas
Visualisation of Large Datasets
- Figure resampling – Automatic reduction of data points for high performance
- Zoom-based aggregation – Detailed view when zooming in
- Interactive downsampling – Smooth navigation without loss of detail
- Efficient rendering – Optimised display even with millions of points
- GPU-accelerated visualisation – Maximum performance at high resolution